The U.S. Bureau of Labor Statistics (BLS) released their August Inflation report on September 12th 2019, for the 12 months through August 2019.
Annual Inflation is Down Slightly
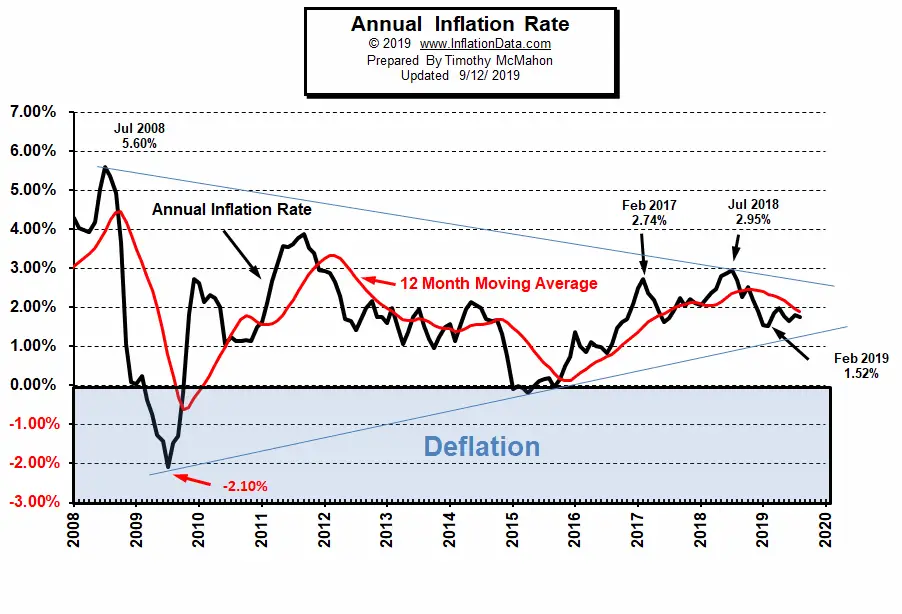
- Annual inflation in August was 1.75% very similar to the 1.79% in May and the 1.81% in July. But still above the 1.65% in June, and below the 2.00% in April. Inflation peaked at 2.95% in July 2018.
- CPI Index in August was 256.558. July was 256.571, June was 256.143, May was 256.092. April’s was 255.548 and March was 254.202.
- Monthly Inflation for August was disinflationary -0.01%, July was 0.17%, June was virtually zero at 0.02%, May was 0.21%, April was 0.53%, March was 0.56%.
- Next release October 10th

Annual inflation for the 12 months ending in August was 1.75% which is below the FED target of 2.00%. At the end of July, FED Chairman Jerome Powell announced the expected lowering of interest rates.
Monthly Inflation:
According to the BLS commissioner’s report, “The Consumer Price Index for All Urban Consumers (CPI-U) increased 0.1 percent in August on a seasonally adjusted basis after rising 0.3 percent in July, the U.S. Bureau of Labor Statistics reported today. Over the last 12 months, the all items index increased 1.7 percent before seasonal adjustment.
Increases in the indexes for shelter and medical care were the major factors in the seasonally adjusted all items monthly increase, outweighing a decline in the energy index. The energy index fell 1.9 percent in August as the gasoline index declined 3.5 percent. The food index was unchanged for the third month in a row.
The index for all items less food and energy rose 0.3 percent in August, the same increase as in June and July. Along with the indexes for medical care and shelter, the indexes for recreation used cars and trucks, and airline fares were among the indexes that increased in August. The indexes for new vehicles and household furnishings and operations declined over the month.”
Read the full commentary here.
Seasonally Adjusted Inflation Table

From the August 2019 column in the table above we can see that on a monthly seasonally adjusted basis the entire Energy category was down -1.9% in August. Gasoline, was the largest monthly loser being down -3.5%. On a Non-adjusted annual basis, however, gasoline was actually down -7.1% over the year and fuel oil was down -8.4%. On an annual basis shelter was up 3.4%, Medical care services were up 4.3%.
Current Inflation Chart
Beginning in July we said, that “the 10-year inflation chart looks like it is getting less volatile (i.e. the blue converging lines) and is settling down in the middle of the road near the 2.00% FED target.” And wondered if after 100 years the FED has finally gotten the hang of managing inflation. We also suggested that it was probably just a decrease in volatility after the massive crash of 2008. This month, the convergence continues. In the stock market, this would be called “pennant” formation setting up for a massive breakout in one direction or the other.
Federal Reserve Actions
For a while now it has been obvious that the 2018 year-end market crash was the result of the Federal Reserve’s actions as they clamped down on the economy, both in raising interest rates and in reducing the debt it acquired during its Quantitative Easing thus beginning its Quantitative Tightening (QT). QT continued throughout August even though once again the FED has proclaimed that they were going to stop QT.
- Quantitative Tightening (QT) continues… check it out here.
- What is Quantitative Tightening?

FED Funds Rate
The FED has however drastically reduced interest rates in August falling from 2.40% in July to 2.13% in August.

For more info See NYSE ROC and MIP.
Inflation Forecast
See our Moore Inflation Predictor to see our current projections.
Not Seasonally Adjusted Monthly Inflation Rates
| Jan | Feb | Mar | Apr | May | Jun | Jul | Aug | Sep | Oct | Nov | Dec | |
| 2016 | 0.17% | 0.08% | 0.43% | 0.47% | 0.41% | 0.33% | (0.16%) | 0.09% | 0.24% | 0.12% | (0.16%) | 0.03% |
| 2017 | 0.58% | 0.31% | 0.08% | 0.30% | 0.09% | 0.09% | (0.07%) | 0.30% | 0.53% | (0.06%) | 0.00% | (0.06%) |
| 2018 | 0.54% | 0.45% | 0.23% | 0.40% | 0.42% | 0.16% | 0.01% | 0.06% | 0.12% | 0.18% | (0.33%) | (0.32%) |
| 2019 | 0.19% | 0.42% | 0.56% | 0.53% | 0.21% | 0.02% | 0.17% | (0.01%) |
See: Monthly Inflation Rate for more information and a complete table of Unadjusted Monthly Rates.
Misery Index
 The misery index as of September 2019 (based on the most recent official government inflation and unemployment data for the 12 months ending in August) is at 5.45% down from 5.51% in July but still above the 5.35% in June.
It had reached a low of 5.32% in February 2019. But it was 6.60% in August 2018 and 6.34% in August 2017.
[Read More…]
NYSE Rate of Change (ROC)©
 The NYSE ROC is once again in Buy/Hold territory after crossing above its moving average.
See the NYSE ROC for more info.
NASDAQ Rate of Change (ROC)©

Hold Signal! Unlike the NYSE, the NASDAQ- ROC remains barely below the moving average.
See NASDAQ ROC for more.
Regional Inflation Information
The U.S. Bureau of Labor Statistics also produces regional data. So if you are interested in more localized inflation information you can find it here.
| AL | AK | AR | AZ | CA | CT | CO | DC | DE | FL | GA | GU | HI | IA |
| ID | IL | IN | KS | KY | LA | MA | MD | ME | MI | MN | MO | MS | MT |
| NC | ND | NE | NH | NJ | NM | NV | NY | OH | OK | OR | PA | PR | RI |
| SC | SC | SD | TX | UT | VA | VI | VT | WI | WA | WI | WV |
You Might Also Like:
From InflationData.com
- How the Currency Exchange Rate Can Affect Business
- How Does Inflation Affect the Cost of Insurance?
- Why Does China Want to Lower the Value of Its Currency?
- Gold as an Investment
Read more on UnemploymentData.com.
- Stretch Your Dollars While Between Jobs
- August Unemployment Report
- Injury at Work? Know Your Rights to Compensation and FMLA
- Taking Your Real Estate Business to the Next Level
- From Testing to the Bar—4 Tips for Starting Law School
From Financial Trend Forecaster
- Asteroid Mining: Science Fiction or Science?
- Why Gold Prices Are About To Skyrocket Even Higher
- From Ice Cream To Toilet Seats: The Most Bizarre Uses For Gold
- Turning Nuclear Waste into “Perpetual” Batteries
- 4 Precious Metals to Consider
From Elliott Wave University
- Almost Inverted Yield Dip Is Bullish for Stocks
- Summer of Love for Gold Bulls: How “Quandary” Became Clarity
- Message from the Stock/Bond Ratio
- Do Facts Support Doom and Gloom or Higher Highs for Stocks and/or Gold?
- Want to See What’s Next for the Economy? Try This.
- Elliott Wave: Market Signaling Fed to Cut Rates Soon
- Is War Good for Stocks?
From OptioMoney.com
- Avoid a Money Pit: 4 Vital Inspection Items before Buying an Older Home
- 3 Benefits of Finding a Reliable Family Lawyer
- 4 Hidden Car Costs
- Buying and Selling Ranch Land: A Beginner’s Guide
- 4 Tips to Cover the Bills When Your Disability Keeps You Home
From Your Family Finances
- Teaching Your Teens the Importance of Saving
- 7 Sure Ways to Increase Your Home’s Value
- 5 Awesome Energy Saving Ways to Cut Your Home Energy Costs Now
- Renovate Your Family Home on a Budget
- Step by Step Guide: How to Calculate Electricity Usage Cost and Charges
Read more on InflationData.com.