The U.S. Bureau of Labor Statistics (BLS) released its January Inflation report on February 13th, 2020, for the 12 months through the end of January 2020.
Annual Inflation Jumps Up Again
- Annual inflation tops the 2019 high set in December at 2.29% reaching 2.49% in January.
- CPI Index in January was up almost 1 point to 257.971, December was 256.974, November was 257.208 down from October’s 257.346
- Monthly Inflation for January was 0.39%, December was -0.09% up from 0.19% in January 2019.
- Next release March 11th
Annual inflation for the 12 months ending in January was up to 2.49%. Annual inflation in December was 2.29%.
The CPI index itself rose almost exactly a full point from 256.974 in December to 257.971 in January after falling since October.
October’s CPI Index was 257.346, November’s CPI index was 257.208 and December’s index was 256.974.
October’s Inflation Rate was 1.76%,
November’s Inflation Rate was 2.05%.
So even though the CPI declined in November and December inflation rose.
The reason lies in the individual monthly components. What we have been seeing is that although the monthly inflation was negative i.e. disinflationary in both November and December 2019, (causing the CPI index to go down) it was not as negative as in 2018. So as the 2018 numbers fell out of the annual inflation calculation and were replaced by less negative numbers the annual inflation rate went up.
Monthly Inflation:
According to the BLS commissioner’s report, “The Consumer Price Index for All Urban Consumers (CPI-U) rose 0.1 percent in January on a seasonally adjusted basis, after rising 0.2 percent in December, the U.S. Bureau of Labor Statistics reported today. Over the last 12 months, the all items index increased 2.5 percent before seasonal adjustment.
The index for shelter accounted for the largest part of the increase in the seasonally adjusted all items index, with the indexes for food and for medical care services also rising. These increases more than offset a decrease in the gasoline index, which fell 1.6 percent in January. The energy index declined 0.7 percent, and the major energy component indexes were mixed. The index for food rose 0.2 percent in January with the indexes for both food at home and food away from home increasing over the month. “
Read the full commentary here.
Seasonally Adjusted Inflation Table

From the January 2020 column in the table above we can see that on a monthly seasonally adjusted basis, Gasoline was down -1.6% after being up 3.1% in December. On a Non-adjusted annual basis, however, gasoline was still up a whopping 12.8% over the year and fuel oil was up 6.5%. On an annual basis, Food away from home was up 3.1%, shelter was up 3.3%, Used cars and trucks were down -2.0% and Medical care services were up 5.1%.
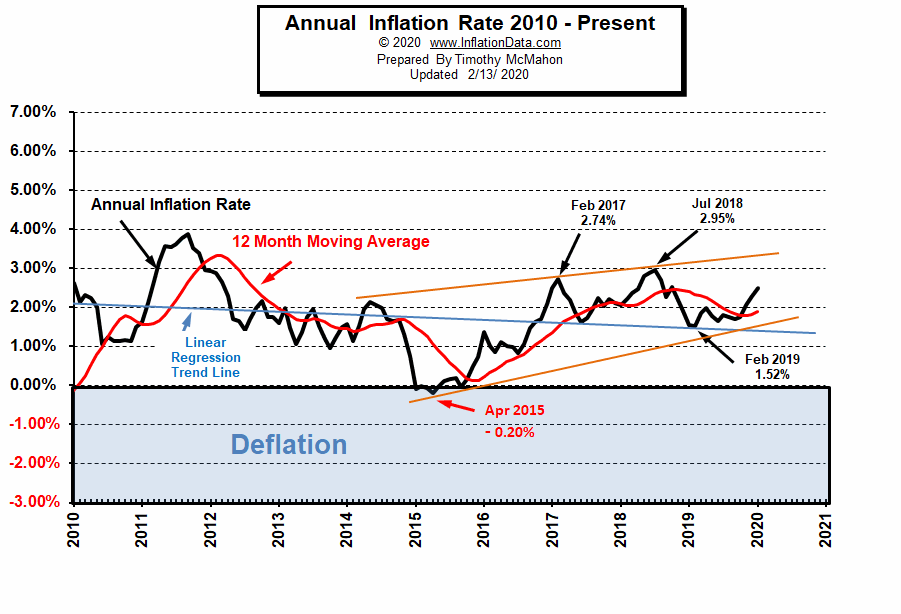
Current Inflation Chart
As we can see from the chart below, throughout 2019 the inflation rate stayed within a fairly narrow range. It crossed above its 12-month moving average in November at just above 2% in November (at 2.05%) while bottoming at 1.52% in February. In December it continued to rise to 2.29%. And January 2020 saw inflation zoom up to 2.49%. Typically, monthly inflation is highest in the first 3 or 4 months of the year so we could still see a drop later on in 2020.
![Annual Inflation Rate 2010- Jan 2020]() Federal Reserve Actions
Federal Reserve Actions
Throughout 2018 the FED followed a policy of “Quantitative Tightening” (QT) in addition to raising the FED Funds rate that they charge banks. QT is the opposite of Quantitative Easing. In “Quantitative Easing” (QE) the FED acquired government debt by buying it on the open market. QT is a process whereby the FED is reducing the debt that it is holding by not renewing Federal Debt that it holds when it matures. Normally, QE would be considered inflationary, while QT would be disinflationary. After the crash of 2008 when a lot of capital was destroyed QE was not strong enough inflationary to overcome all of the deflationary forces caused by the crash.

In this closer view, we can see the FED reduced “Assets” throughout 2018 and most of 2019 i.e. pursuing a tighter monetary policy. Then they realized they went too far and increased assets for a couple of months at the end of 2019. And so far in 2020, they have been relatively flat.

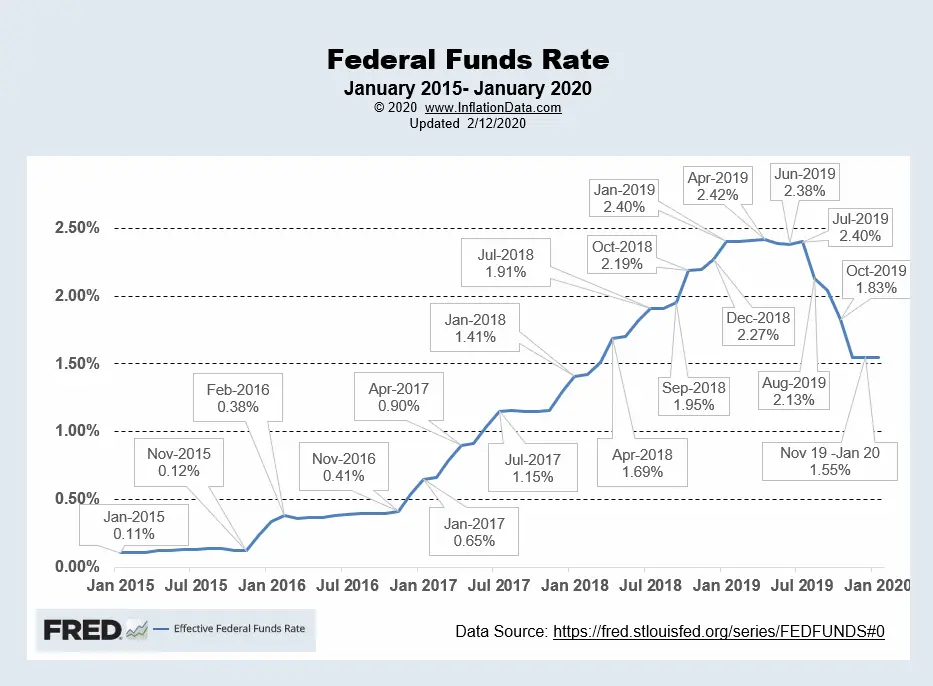
FED Funds Rate
The FED Funds rate leveled off, for the first half of 2019 around 2.4%. After July, the FED lowered the FED Funds rate significantly falling from 2.40% in July to 1.55% in November. The FED also appears to have halted the easing by holding the FED Funds rate steady at 1.55% from November through January.
 For more info See NYSE ROC and MIP.
Inflation Forecast
The following chart was our forecast for last month, projecting an increase for the month. The actual inflation rate was slightly above our “extreme high” projection. We had projected an extreme high of 2.45% and we got 2.49%.

See our Moore Inflation Predictor to see our current projections.
Not Seasonally Adjusted Monthly Inflation Rates
| Jan | Feb | Mar | Apr | May | Jun | Jul | Aug | Sep | Oct | Nov | Dec | |
| 2016 | 0.17% | 0.08% | 0.43% | 0.47% | 0.41% | 0.33% | (0.16%) | 0.09% | 0.24% | 0.12% | (0.16%) | 0.03% |
| 2017 | 0.58% | 0.31% | 0.08% | 0.30% | 0.09% | 0.09% | (0.07%) | 0.30% | 0.53% | (0.06%) | 0.00% | (0.06%) |
| 2018 | 0.54% | 0.45% | 0.23% | 0.40% | 0.42% | 0.16% | 0.01% | 0.06% | 0.12% | 0.18% | (0.33%) | (0.32%) |
| 2019 | 0.19% | 0.42% | 0.56% | 0.53% | 0.21% | 0.02% | 0.17% | (0.01%) | 0.08% | 0.23% | (0.05%) | (0.09%) |
| 2020 | 0.39% |
See: Monthly Inflation Rate for more information and a complete table of Unadjusted Monthly Rates.
Misery Index

The misery index as of February 2020 (based on the most recent official government inflation and unemployment data for the 12 months ending in January) is at 6.09%. up slightly from 5.79% in December.
[Read More…]
NYSE Rate of Change (ROC)©

Buy Signal
The market has passed a milestone of doubling since the September 2011 low (up 108.8%). It is up 0.71% since last month, 3.63% the previous month, 5.49% in November and 1.18% in December. Results for the previous 3 months were mixed with October being down about -3%, September being up about 4% and August being down about -4.5%. On an annual basis, the NYSE is up 13.32% down from last month’s annual peak of 18.6%! Of course, we have to remember that in 2018 the NYSE index had a terrible 4th quarter. It fell -4.93% in October, -0.17% in November, -3.79% in December and -0.18% in January, so it is coming off a low.
See the NYSE ROC for more info.
NASDAQ Rate of Change (ROC)©

Buy Signal! In October the NASDAQ lost -3.26 and then issued a buy signal as it crossed through its moving average while logging a massive 7.37% return in November. In December it tacked on another 1.53% and then in January it coincidentally logged another 7.37% gain. February showed a 5.13% gain. This gives it an annual 31.07% down from 32.43% last month. We expect that eventually, the moving average (MA) will catch up with the ROC. Then the ROC falls below the MA, whipsawing around for a while before generating a true sell signal.
See NASDAQ ROC for more.
Regional Inflation Information
The U.S. Bureau of Labor Statistics also produces regional data. So if you are interested in more localized inflation information you can find it here.
| AL | AK | AR | AZ | CA | CT | CO | DC | DE | FL | GA | GU | HI | IA |
| ID | IL | IN | KS | KY | LA | MA | MD | ME | MI | MN | MO | MS | MT |
| NC | ND | NE | NH | NJ | NM | NV | NY | OH | OK | OR | PA | PR | RI |
| SC | SC | SD | TX | UT | VA | VI | VT | WI | WA | WI | WV |
You Might Also Like:
From InflationData.com
- Modern Monetary Theory
- Investing to Fight Inflation
- Cumulative Inflation By Category 1996-2016
- If Everything Big is Increasing in Cost at Some Rate Faster than Inflation Why Hasn’t Inflation Risen to Match?
Read more on UnemploymentData.com.
- Popular Side-Hustles for More Income
- January Employment Report- Maybe Not as Good?
- Intrapersonal Intelligence
- Give Your Resume a Boost by Increasing Your Skill Set
- How to Get Recruiters on Linkedin (And Land That Dream Job!)
From Financial Trend Forecaster
- Financial Real Estate Trends Investors Should Understand for 2020
- Gold is Still King of the Investing Market
- The Markets in Perspective: What Goes up Must Come down?
- Is Bill Gates Right On Energy Investing?
- The Oil Crisis Saudi Arabia Can’t Solve
From Elliott Wave University
- Repeating Patterns = Profit Potential
- The Beginning of a Long-Term “Secular” Bull Market?
- What Does this Rare & Rapid Drop in Manufacturing Mean?
- Bullish Signal Has Only Happened 10 Times in the Last 94 Years.
- Spotting a 178-Year-Old Firm’s Collapse… 2 Years in Advance
From OptioMoney.com
- Learning to Trade from Video Tutorials
- How Saxo Bank Democratizes Trading and Investment
- Five Business Tips to Help Your Company Thrive
- Have Minimal Car Insurance? What to Do in Case of an Accident
- How to Choose a Residential Roofing Contractor
From Your Family Finances
- Buying Your First Car? Here Are Some Tips
- How to Manage Money as a Couple
- Expenses to Prepare for Before Having Children
- 3 Ways to Pay Less for Insurance in 2020
- How to Save Money While Waiting for HVAC Repairs
Read more on InflationData.com.
