
Annual Inflation Rebounds
- Annual Inflation rose to 0.65%.
- CPI Index rose from 256.394 in May to 257.797 in June.
- Monthly Inflation for June was 0.55%, May was 0.002%, April was -0.67%, March was -0.22%, February was 0.27%.
- The FED may be slowing its “Quantitative Easing” in an effort to prevent hyperinflation.
- FED Funds Rate up slightly but still remains near Zero.
- Next release August 12th
The Bureau of Labor Statistics Released the Inflation Data for the 12 months ending in June on July 14th.
Monthly Inflation SOARS to 0.55%.
Annual inflation for the 12 months ending in June was 0.65%, May was 0.12%, April was 0.33%, March was 1.54% down sharply from February’s 2.33% and January’s 2.49%.
The CPI index itself was up from 256.394 in May to 257.797 in June. Resulting in a monthly inflation rate of 0.55% (accounting for the majority of the Annual Inflation).
 The Moore Inflation Predictor is showing the possibility of a rebound in inflation late in 2020. There is the possibility that the massive FED money creation will result in much higher inflation or even hyperinflation. However, there is some indication that the FED is cutting back on its money pumping.
Monthly Inflation:
According to the BLS commissioner’s report, “The Consumer Price Index for All Urban Consumers (CPI-U) increased 0.6 percent in June on a seasonally adjusted basis after falling 0.1 percent in May, the U.S. Bureau of Labor Statistics reported today. Over the last 12 months, the all items index increased 0.6 percent before seasonal adjustment.
The gasoline index rose sharply in June after recent declines and accounted for over half of the monthly increase in the seasonally adjusted all items index. The energy index increased 5.1 percent in June as the gasoline index rose 12.3 percent. The food index also rose in June, increasing 0.6 percent as the index for food at home continued to rise.
The index for all items less food and energy rose 0.2 percent in June, its first monthly increase since February. The index for motor vehicle insurance increased sharply in June after recent declines. The indexes for apparel, shelter, and medical care also increased in June, while the indexes for used cars and trucks, recreation, and communication all declined.
The all items index increased 0.6 percent for the 12 months ending June; this compares to a 0.1-percent increase for the 12 months ending May. The index for all items less food and energy increased 1.2 percent over the last 12 months. The food index increased 4.5 percent over the last 12 months, with the index for food at home rising 5.6 percent. Despite increasing in June, the energy index fell 12.6 percent over the last 12 months. ”
Seasonally Adjusted Inflation Table

On the chart above, we can see that on an unadjusted basis inflation is up 0.6% for the year AND on an adjusted basis it is up the same amount on a monthly basis. We can also see that
Food is up the same amount in June alone. Energy is up 5.1% in one month with gasoline up a whopping 12.3%.
Current Inflation Situation
Inflation bottomed at 0.12% in May and more than Quintupled to 0.65% in June but is still below 1%.

Not Seasonally Adjusted Monthly Inflation Rates
Monthly inflation for June was 0.55% comprising the majority of the annual inflation since March and April’s deflation canceled out most of the rest of the year’s inflation.
| Jan | Feb | Mar | Apr | May | Jun | Jul | Aug | Sep | Oct | Nov | Dec | |
| 2016 | 0.17% | 0.08% | 0.43% | 0.47% | 0.41% | 0.33% | (0.16%) | 0.09% | 0.24% | 0.12% | (0.16%) | 0.03% |
| 2017 | 0.58% | 0.31% | 0.08% | 0.30% | 0.09% | 0.09% | (0.07%) | 0.30% | 0.53% | (0.06%) | 0.002% | (0.06%) |
| 2018 | 0.54% | 0.45% | 0.23% | 0.40% | 0.42% | 0.16% | 0.01% | 0.06% | 0.12% | 0.18% | (0.33%) | (0.32%) |
| 2019 | 0.19% | 0.42% | 0.56% | 0.53% | 0.21% | 0.02% | 0.17% | (0.01%) | 0.08% | 0.23% | (0.05%) | (0.09%) |
| 2020 | 0.39% | 0.27% | (0.22%) | (0.67%) | 0.002% | 0.55% |
See: Monthly Inflation Rate for more information and a complete table of Unadjusted Monthly Rates.
For more information See Annual Inflation.
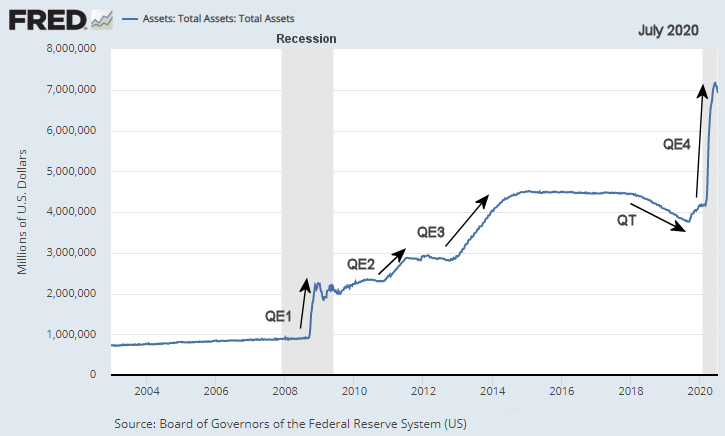
Federal Reserve Actions
In response to the recent Coronavirus crash, the FED implemented QE4 equal in speed to QE1 and greater in magnitude than QE1, QE2, and QE3 combined. This is a MASSIVE increase in the money supply. But in June we see a decided decline. Many believe that this slackening will cause the stock market to crash. We cover this in depth here.
Here we see a closer look at the recent Quantitative Tightening (i.e. QT 1 and QT 2) and the associated levels on the NYSE.

FED Funds Rate
In this chart, we can see that the FED reduced the FED Funds Rate beginning in August 2019 through November 2019. From there through February 2020 they were relatively flat. But in March in an effort to fight a coming market crash due to falling oil prices and coronavirus fears the FED dropped rates to 0.65% with hints that they might go as low as 0% or possibly even negative. In April they reduced rates to virtually zero (i.e. 0.05%) and held it at that level in May. But we see a slight Uptick in June to 0.08%. Could this indicate that the FED is changing course to become more restrictive?

For more info See NYSE ROC and MIP.
Misery Index

In April the Misery Index shot up to 15.03% based on 14.7% unemployment and 0.33% inflation. In May it fell back slightly due to a decrease in the Unemployment rate as some people began returning to work. The highest peak for 2019 was at 5.79% in December and the Low was in September at 5.21%. Previous peaks were 6.87% in July 2018 and 7.44% in February 2017. In June unemployment fell to 11.1% and inflation rose slightly to 0.65% resulting in a Misery index of 11.75%.
[Read More…]
NYSE Rate of Change (ROC)©

Sell Signal
Last month the NYSE rebounded back to almost the zero line levels generating a “Traders Buy” signal and a Conservative Investors Hold Signal. But in July it failed to cross above the zero line and its moving average fell over -4.80%, for the month to -8.8%. Plus, the FED appears to be not as accommodative as it has been, so we have changed to a sell signal.
See the NYSE ROC for more info.
NASDAQ Rate of Change (ROC)©

Hold Signal!
Unlike the NYSE the NASDAQ ROC did not fall below zero and has rebounded quicker. But as we said in the NYSE ROC the FED might be tightening and Summer doldrums are approaching so caution is warranted.
See NASDAQ ROC for more.
Regional Inflation Information
The U.S. Bureau of Labor Statistics also produces regional data. So if you are interested in more localized inflation information you can find it here.
| AL | AK | AR | AZ | CA | CT | CO | DC | DE | FL | GA | GU | HI | IA |
| ID | IL | IN | KS | KY | LA | MA | MD | ME | MI | MN | MO | MS | MT |
| NC | ND | NE | NH | NJ | NM | NV | NY | OH | OK | OR | PA | PR | RI |
| SC | SC | SD | TX | UT | VA | VI | VT | WI | WA | WI | WV |
You Might Also Like:
- From InflationData.com
- Is the FED Tightening or Is Hyperinflation on the Horizon?
- 5 Countries Most at Risk for Deflation
- May Inflation “Astonishingly Low”
- Why Inflation Affects Various Individuals Differently
Read more on UnemploymentData.com.
- Over 5 Million More Jobs in June
- 3 Ways to Afford Medical Treatment When You’re Between Jobs
- Three Ways You Can Market Your Freelance Business
- 4 Tests And Examinations You Need to Pass Before Becoming a Trucker
- Tips for Starting a Business While Unemployed
From Financial Trend Forecaster
- 4 Investments Making Waves in the Technology Sector
- Mutual Funds
- Bulls Beware: A Dark Cloud Is Forming Over Oil Markets
- Oil Goes from Zero to $35 in a Month, But is it Enough?
- Top 5 Reasons Why 5G Will Change the Finance Industry
From Elliott Wave University
- Seeking Certainty in Uncertain Times?
- Emerging Markets and Epidemics
- Deflationary Psychology Versus the Fed: Here’s the Likely Winner
- Crude Oil’s 2020 Crash: See What Helped (Some) Traders Pivot Just in Time
- Stocks: Is the Worst Over or is there Worse Yet to Come?
From OptioMoney.com
- Should You Buy a Second Home?
- Learning to Trade from Video Tutorials
- How Saxo Bank Democratizes Trading and InvestmentFive Business Tips to Help Your Company Thrive
- Have Minimal Car Insurance? What to Do in Case of an Accident
- How to Choose a Residential Roofing Contractor
From Your Family Finances
Read more on InflationData.com.